Note
Go to the end to download the full example code.
Subplot Layouts#
This example shows how to create figures with multiple subplots. Subplots are useful for comparing related visualizations side by side.
import matplotlib.pyplot as plt
import numpy as np
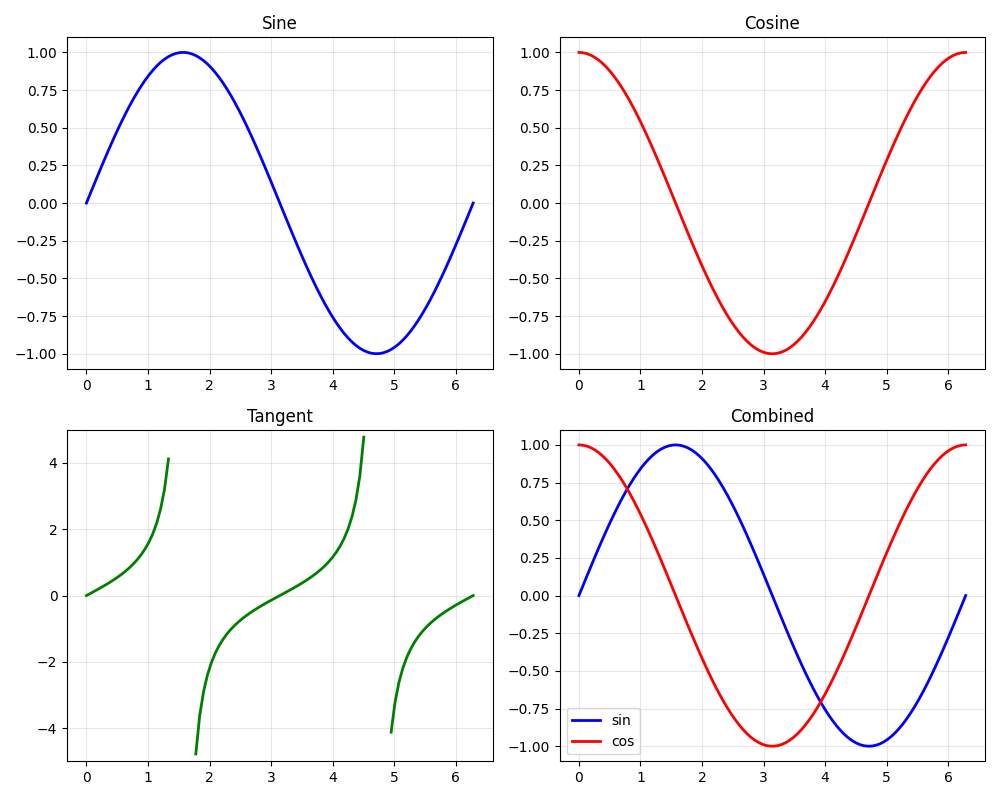
Grid of Subplots#
A 2x2 grid showing different mathematical functions.
fig, axes = plt.subplots(2, 2, figsize=(10, 8))

x = np.linspace(0, 2 * np.pi, 100)

# Sine
axes[0, 0].plot(x, np.sin(x), "b-", linewidth=2)
axes[0, 0].set_title("Sine")
axes[0, 0].grid(True, alpha=0.3)

# Cosine
axes[0, 1].plot(x, np.cos(x), "r-", linewidth=2)
axes[0, 1].set_title("Cosine")
axes[0, 1].grid(True, alpha=0.3)

# Tangent (clipped)
y_tan = np.tan(x)
y_tan[np.abs(y_tan) > 5] = np.nan
axes[1, 0].plot(x, y_tan, "g-", linewidth=2)
axes[1, 0].set_title("Tangent")
axes[1, 0].set_ylim(-5, 5)
axes[1, 0].grid(True, alpha=0.3)

# Combined
axes[1, 1].plot(x, np.sin(x), "b-", label="sin", linewidth=2)
axes[1, 1].plot(x, np.cos(x), "r-", label="cos", linewidth=2)
axes[1, 1].set_title("Combined")
axes[1, 1].legend()
axes[1, 1].grid(True, alpha=0.3)

plt.tight_layout()
plt.show()
Total running time of the script: (0 minutes 0.249 seconds)