Note
Go to the end to download the full example code.
Basic Plot#
This example demonstrates a simple matplotlib plot with sphinx-gallery. The first generated figure is automatically used as the gallery thumbnail.
import matplotlib.pyplot as plt
import numpy as np
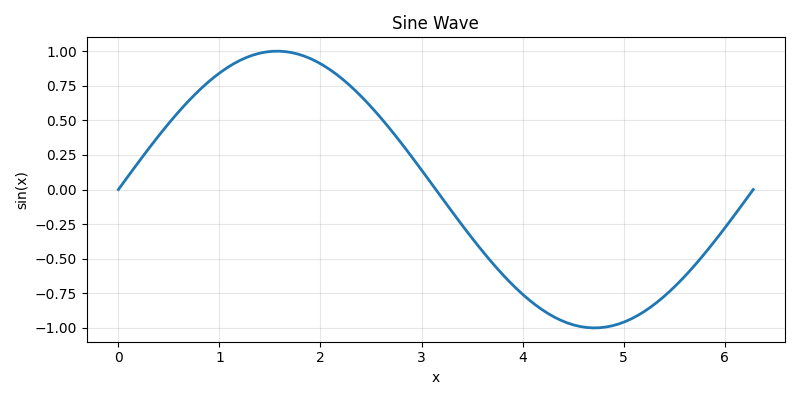
Simple Line Plot#
A basic sine wave visualization showing the core plotting workflow.
x = np.linspace(0, 2 * np.pi, 100)
y = np.sin(x)

plt.figure(figsize=(8, 4))
plt.plot(x, y, linewidth=2)
plt.xlabel("x")
plt.ylabel("sin(x)")
plt.title("Sine Wave")
plt.grid(True, alpha=0.3)
plt.tight_layout()
plt.show()
Total running time of the script: (0 minutes 0.128 seconds)